Wargaming Benchmarks
v1.2 - updated 28/11/17
This essay has been inspired by: Historical Characteristics of Combat for Wargames (Benchmarks), by Robert McQuie which was produced under US Army contract in 1988. It can be found on DTIC: http://www.dtic.mil/dtic/tr/fulltext/u2/a200036.pdf
The research paper was prompted by US Army dissatisfaction with it wargames models as there was a feeling that they dealt with unrealistic forces and gave unrealistic outcomes. An attempt was made to measure what a real battle looked like and provide parameters within which a simulation could be said to be a reasonable representation of real life. This was done by analysing historical 20th century battles.
This is, of course, most interesting for us amateur wargames who are concerned with the realism of our games.
We will spend some time looking at how the "benchmark" is achieved and how realistic it might be. The dataset for the bench mark is mostly taken from divisional and corps battles. In the second part of this essay we will compare the benchmarks to the data set of British infantry attacks in WW2 given in: Army Operational Research Group report 17/52, An Analysis of Infantry Advance Rates in Battle (WO291/1159). This will determine if the outcomes hold for smaller battles.
If we have developed a historical scenario then, assuming the research is good, it should have realistic forces. However the parameters in the study could act as a "sanity check" to ensure we have not missed anything. If your tastes stretch to "what ifs" such as Operation Sealion, the parameters are an even more valuable check.
At the conclusion of our game we might wonder if the result is realistic. The research gives typical casualty and advance rates for battles against which we could measure the tabletop outcomes.
Its worth noting at this point most of the battles studied were divisional size or bigger, so some caution must be used in applying the results to smaller scaled table top engagement. In the author's opinion the data set really can not be applied to small skirmish games, and the comparison with WO291/1159 will confirm this. A typical game of Command Decision, or any other "platoon scale" game usually has between a quarter and half a division on table. An operational game of BBWW2 has typically the combat elements of at least one division on table so the research findings should be directly applicable.
The first thing the researchers discovered is there is no such thing as a typical battle and that parameters are very variable. For example, of the battles studied, the the ratio of attacker's artillery to defender's ranged from a low point of 0.2:1 for some Arab Israeli battles, to 444:1 for the assault on Okinawa in WW2. One point to note is that there are no battles where either side has no artillery, which means tabletop scenarios were either side lacks artillery should be viewed with suspicion from a realism perspective.
The database was made of WW2, Korean War and Arab Israeli battles up to 1973. The second finding is that the battles do not differ in any systematic way between wars or theatres. In effect they are saying that this database should be applicable to all engagements since 1939 and probably to future engagements as well . However all the engagements studied were clashes between organised forces. There was no attempt to measure the validity of the results when comparing counter insurgency battles. So the results should be applicable to, say Desert Storm, but probably not to the war against the Taliban in Afghanistan.
Its interesting to note that there is other research, which we may look at in another essay, that says advance rates haven't changed in at least 400 years, and that casualties have not changed much either. So there is a reasonable possibility that the outcomes benchmarks could apply to scenarios before 1939, including, for example, the original Bloody Big Battles.
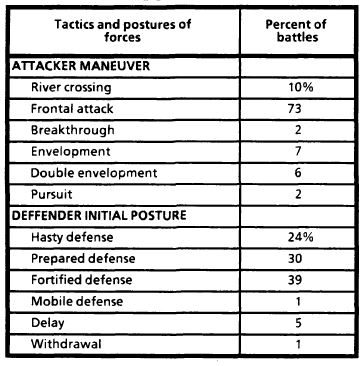
Before talking about the report's methods it is interesting to look at the types of battles that made up the database used for the research.
As can be seen the vast majority are frontal attacks. Indeed, river crossings are just a special type of frontal attack so 83% of battles are assaults on an in-place defence. What is conspicuous by its absence is the encounter battle or meeting engagement which is so rare it doesn't even feature in the database, though it could be argued a mobile defence may result in an encounter battle. What wargames might term an "equal points" battle with two evenly matched forces moving from their respective table edges, is unrealistic. It would probably be fair to say such battles never happen.
To determine what made up a typical battle the researchers went through some statistical shenanigans to determine plausibility and centrality criteria for a realistic battle. The plausibility criteria contain 90% of historical battles, the centrality criteria contain 50% of historical battles. For example if you set up and played a scenario once you would expect the forces involved and outcomes to be within the plausibility criteria. If the same scenario was played many times the average results and forces involved should be within the centrality criteria.
The authors are keen to point out that if a battle, or series of battles, does not fall within the criteria it does not necessarily mean the game is broken, after all 10% of historical battles don't fit the plausibility criteria. It does mean that the scenario and rules governing the outcome should be examined closely. The author would argue that in the unlikely event a scenario is played, say, 10 times and it doesn't meet the centrality criteria, then it should be very closely looked at.
The following tables give the plausibility and centrality criteria (in that order)
For example if playing the BBWW2B Nomonhan battle, on the 3/7/39 the Soviets have 130 tanks (BBWW2B ratio is 1:10), excluding armoured cars and the Japanese have no tanks. We will take the frontage as 4ft in game scale which is 8km. 130/8 = 16.25, which falls nicely within the centrality criteria. The issue on the other side is that on the 3rd the Japanese have no tanks involved in the battle, which does not meet the plausibility criteria. This highlights one of the limitations of the database. It describes battles between mechanised opponents and certainly many battles from 1939 and later are between predominantly or exclusively infantry/artillery forces.
In the application of the tables further issues arise. In the paragraph above I picked 8km as the frontage as its the table width. However the Soviet tanks have the option to, and often do, attack all over the length of the table (12km) from the flank, but usually not over the entire length in any one game. The actual frontage covered is debatable.
Its not clear what to do with the armoured cars many of which are equivalent in firepower to the BT tanks.
There is a further example from the 1967 Arab Israeli war here
There is an issue with the squad density. For the defender the average is 6.7 squads per kilometre, about 2 platoons. However there are 1300 men per km as a median. Even if we allow for the crews of the artillery and tanks etc and assume some reasonable proportion of rear area troops, we end up with many more men than can be accounted for by 6.7 squads (c 67 men). If we take a look in the source data it looks rather peculiar for example there is a battle labelled "Rafid" with 4958 men defending and only 4 "squads". The squad data looks totally unreliable and in my opinion should be ignored.
None the less I believe these are excellent criteria with which to test the validity of a scenario and its results, however they should not be used to govern a scenario or results just as a double check on a scenario's plausibility.
It is interesting to look at the outcomes in a little more detail. Firstly, contrary to what you might first suppose attackers always take proportionally less casualties than the defender. This means any scenario where the attackers take proportionally more casualties than the defenders is suspect from a realism viewpoint. Of course if this happens the un-realism might be that the "club muppet" is in charge of the attackers. In the real world all commanders have some degree of competence training which certainly can't be said of all wargamers!
The percentage casualties might be an eye opener for people used to playing with rule sets where the result is 90% casualties on both sides with alarming frequency. The maximum percentage of casualties which remains plausible is 22% for the defenders and a mere 5.5% for the attackers. Tank casualties are higher but barely exceed 50%. There is more to be said about casualty rates in real life and in games but the author is convinced that most wargames rules allow for much higher than realistic casualties.
Combat intensity in the tables above, is how long the battle lasts for. This has implications for what a realistic scenario length is and it is worth bearing in mind when designing one. As we shall see in later essays most wargames rules allow units to do far too much movement and shooting in a turn of the described length. This makes designing scenario lengths tricky to get right.
The advance rates are interesting. The median (most likely) advance is only 1.7km, which is 34" at Command Decision scale and 10" at BBWW2B scale. The centrality criteria give a maximum advance rate of 5km. That's the entire table for Command Decision but only 30" for BBWW2B. Assuming the rest of the scenario is realistic and the rules produce the correct results this has interesting influences on where the "victory locations" should be placed in a tabletop scenario.
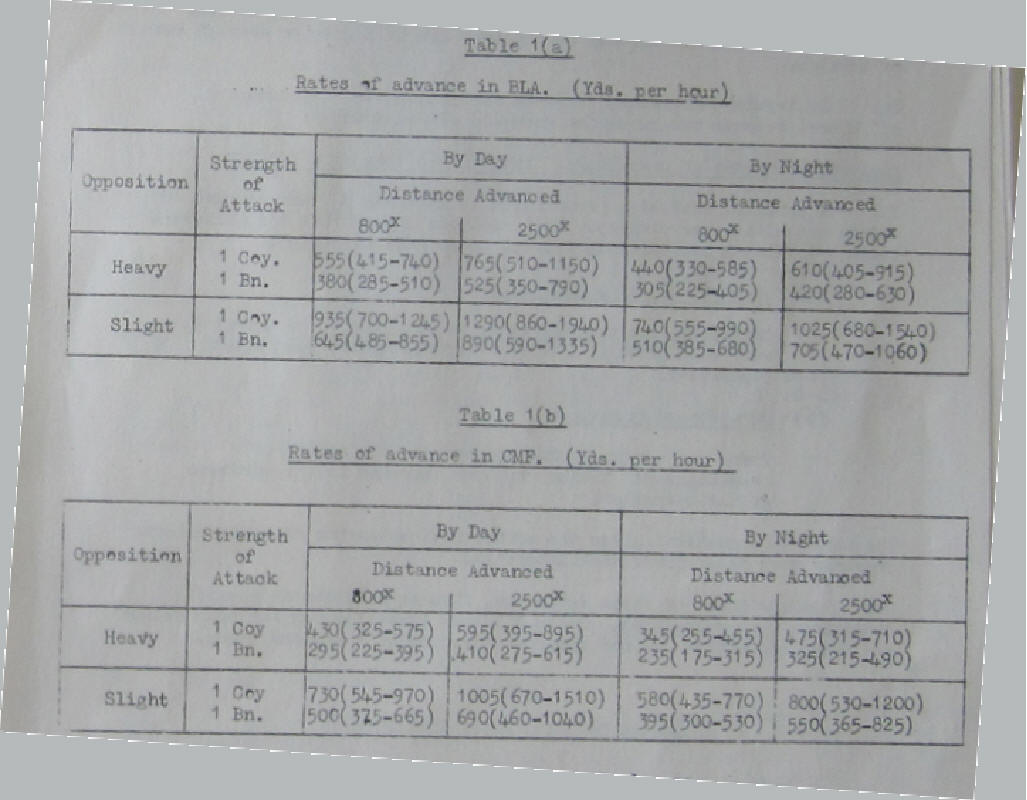
Other sources of advance rates are available and its interesting to contrast their findings with the findings of the benchmark report. Army Operational Research Group report 17/52, An Analysis of Infantry Advance Rates in Battle (WO291/1159) gives data on advance rates of British infantry battalions in the latter part of WW2 on both the Italian and Western European Fronts
A small caveat at this point. Neither report explains in detail how each parameter, such as casualties, was measured, so its possible we are not comparing like with like between reports. However, the author believes that the terms are well enough defined that comparisons are still meaningful.
The first point to make about the table above is about the "distance advanced" - this was the planned distance of the advance. Interestingly the British seem never to have planned an advance of more than 2500yds (2.3km). The text in the report indicates that some of the 2300yds usually comprised of an approach march, so it is not an advance rate as such as some portion of it was not against an enemy. The 800yds advance (0.7km) is considered to be all against enemy opposition. In either case the values nicely sit within the centrality criteria of the benchmarking report.
The maximum advance distance recorded was 14000yds (12.8km) which is an outlier (only two entries of over 10000yds exist in the data set). Although that does not meet the centrality criteria it does meet the plausibility criteria. The minimum advance was 300yds (0.3km) which again meet the plausibility criteria but is just outside the centrality criteria.
If we analyse the underlying dataset for the advance rates we find the median it comes out as 1.714km which is amazingly close to the median in the benchmark report. The plausibility boundaries are 0.55km and 5.5km, the centrality boundaries are 0.91km and 2.74km. The plausibility boundaries are very nearly within the original report's centrality boundaries. This indicates that, at least for advance rates, the data is a very good match for the original model despite the British data set being taken at battalion level and the originals report's data being mostly at divisional and higher levels.
However when we look at battle duration and casualties the battalion data does not match the original report. The median level for casualties is 3.2% conservatively assuming all battalions started at full strength, which is higher than the large battle rate. Plausibility runs from 0% to 17.6%, centrality from 1% to 7.6%. The median battle duration is 3 hours for a battalion attack with plausibility running from 3/4 hour to 12 hours and centrality running from 13/4 hours to 6 hours. Battalion battles on average appear shorter in duration than larger battles.
It is a fact that in a division the casualties fall predominantly on the infantry. Other research, which we may delve into at another time, shows that within a division sub units' casualties can vary significantly, so the higher casualty rate at the battalion level is not unexpected.
On the face of it, given the advance rate fits very nicely together for both studies, it seems inexplicable that the battalion battles are much shorter than the higher level battles in the original report. However the definition in the battalion study indicates that the times represented are "the time taken from crossing the start line to the leading troops reaching the objective." The time the battalion was in battle for, for example repulsing German counter-attacks, may have been much longer than indicated.
So it seems the benchmark study's advance rates apply to smaller units such as battalions, however the casualty figures for battalions are often much higher. Given the dataset for battalions it is not possible to say anything about battle duration. However, given battalions make up divisions and which battalion is in contact at any one time will vary, it seems reasonable to suppose that battalions are "in battle" for less time than the division would be considered "in battle". Thus its unlikely the battle duration figures in the main study will apply to battalion level combats.
One further point is of interest from the battalion study, and that's the number of attacks conducted with less than the full battalion. Only 2% of the attacks in the battalion database were conducted with the maximum four companies, 58%, were conducted with three companies, 22% were conducted by a pair of companies and 17% by a single company. This means on average an attack was conduced with 2.5 companies or 61% of maximum strength. BBWW2B only allows 3 stands to fire (usually out of 6 in a battalion), i.e. only 50% of the available firepower. This figure is gratifying close to the actual 61% figure given in the study.
As we have this data we can calculate the median company casualties will be 1/61% * 3.2% = 5.2%. The figures for upper and lower bounds of centrality are 1.6% and 12.5% respectively and the bounds of plausibility are 0% and 28.9%
So can this research help us to design more realistic scenarios? I believe it can be an aid, but it is clearly slanted towards divisional size battles between mechanised formations. As we can see many of the findings do not scale well to smaller units. Use the benchmark as a sanity check for a scenario or its outcome, but remember 10% of historical battles do not meet the credibility criteria.
In the future will be essays on movement and advance rates, and after that on casualty rates